
 Sunil Gill
The average mobile user spent about 3.6 hours a day in apps in 2025, according to Sensor Tower, and people spent 5.3 trillion hours in apps over the year. American adults check their phones 186 times a day, roughly once every five minutes they are awake, and 41% say they are online "almost constantly". In the UK, where the regulator measures it directly, adults spend 4 hours 30 minutes a day online, 77% of it on a smartphone.
This report brings together the smartphone usage figures that come from measurement or large surveys, with the date and method of each, and separates what is measured (app analytics, web traffic) from what people report about themselves.
Smartphone usage statistics: the key figures
- 3.6 hours a day in apps per mobile user, and 5.3 trillion hours in total across iOS and Google Play in 2025, up 3.8% (Sensor Tower).
- 186 phone checks a day for US adults, down from 205 a year earlier (Reviews.org survey, late 2025).
- About 4 hours a day of US screen time on phones, from 4 hours 6 minutes for Gen Z to 2 hours 8 minutes for Baby Boomers (Reviews.org).
- 41% of US adults are online almost constantly, rising to 63% of 18 to 29 year olds (Pew Research Center, 2025).
- 4 hours 30 minutes a day online for UK adults in May 2025, 77% of it on smartphones; 18 to 24 year olds spend 6 hours 20 minutes (Ofcom).
- 59% of the world's web traffic comes from mobile phones, against 39% from desktops (StatCounter, September 2026).
- 22 GB of mobile data per smartphone per month in 2025, forecast to reach 42 GB by 2031 (Ericsson).
How much time people spend on their phones
There are two ways to measure this, and they give different answers. App analytics firms measure time in apps across hundreds of millions of devices. Surveys ask people, who usually underestimate.
Measured: time in apps
Sensor Tower's State of Mobile 2026 puts total time in iOS and Google Play apps at 5.3 trillion hours in 2025, 3.8% more than in 2024, which works out at roughly 3.6 hours a day per mobile user. Growth has slowed to low single digits because the audience is saturated; the extra hours now come from existing users rather than new ones. Generative AI apps were the exception, with 48 billion hours in 2025, 3.6 times the total for 2024.
Ofcom measures UK adults' online time through a metered panel. In May 2025 the average was 4 hours 30 minutes a day across personal smartphones, tablets and computers, up 10 minutes on 2024, and smartphones accounted for 77% of it, up from 75%. That is about 3 hours 28 minutes a day on the phone, close to the Sensor Tower figure.
Reported: what Americans say
Reviews.org's survey of about 1,000 US adults in late 2025 found an average of around 4 hours a day on the phone. By generation:
View as table
| Period | Value |
|---|---|
| Gen Z | 4h 06m |
| Millennials | 3h 57m |
| Gen X | 3h 05m |
| Boomers | 2h 08m |
Source: Reviews.org, Cell Phone Usage Stats 2026
Most of that time is social and video. DataReportal's Digital 2026 report puts the global adult average at more than two and a half hours a day on social and video platforms, which is covered in the social media statistics report. Screen time across all devices is in the screen time statistics report.
How often people check their phones
The same Reviews.org survey found US adults check their phones 186 times a day, down 9% from 205 the year before. Over a 16-hour waking day that is once every five minutes. The habits around it:
| US adults, late 2025 | Share |
|---|---|
| Check their phone within 10 minutes of waking | 84.6% |
| Use their phone while watching TV | 87.4% |
| Use their phone on the toilet | 67.9% |
| Use their phone while eating dinner | 56.4% |
| Consider themselves addicted to their phone | 45.8% |
| Use their phone while driving | 29.4% |
These are self-reported, so treat the levels with caution and the direction as more reliable. The fall in daily checks from 205 to 186 fits Ofcom's finding that younger adults are the most likely to use tools to limit their screen time.
Who uses phones most
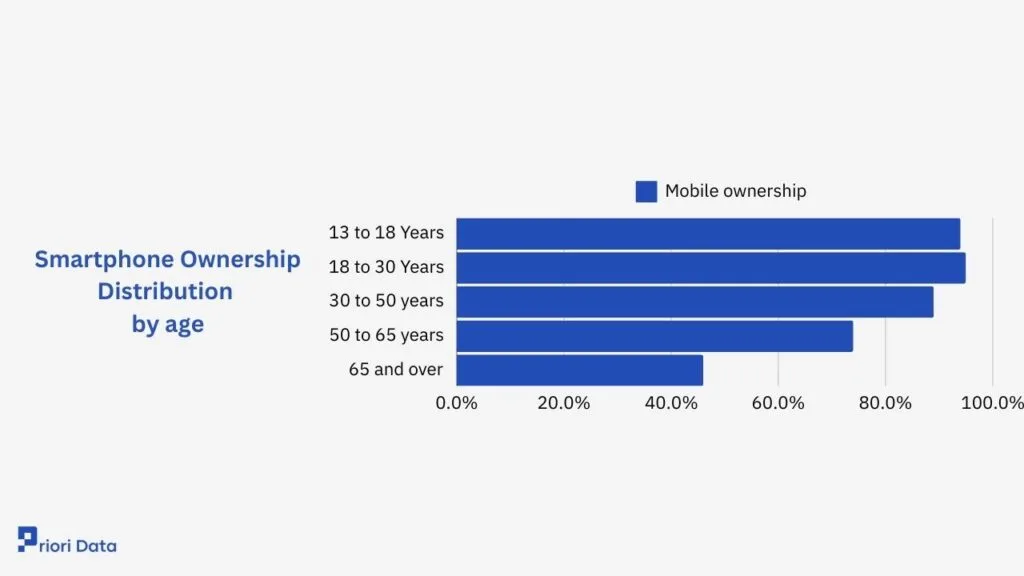
Age explains more than anything else. Pew's 2025 survey asked US adults how often they go online:
View as table
| Period | Value |
|---|---|
| 18 to 29 | 63% |
| 30 to 49 | 54% |
| 50 to 64 | 33% |
| 65+ | 14% |
Source: Pew Research Center, January 2026
Income runs the other way from what people expect: 50% of adults in households earning $100,000 or more are online almost constantly, against 34% of those earning under $30,000. Lower-income Americans are, however, far more likely to depend on the phone alone. 16% of US adults have a smartphone but no home broadband, and that rises to 34% of households under $30,000 and 27% of 18 to 29 year olds.
In the UK, Ofcom finds 18 to 24 year olds online for 6 hours 20 minutes a day and the over-65s for 3 hours 20 minutes. The heaviest smartphone users by share are 25 to 34 year olds, who do 85% of their online time (4 hours 32 minutes) on the phone, while 18 to 24 year olds spend the most absolute time on phones at 5 hours 5 minutes. Women spend 26 minutes a day more online than men.
What people use their phones for
Ofcom's panel shows UK adult smartphone users opening an average of 41 different apps a month in May 2025, three more than a year earlier. The most-used apps are the same three every year: WhatsApp (92% of smartphone users in the month), the Facebook app (85%) and Google Maps (77%). Facebook and Messenger together reach 93% of UK online adults and take 42 minutes a day; WhatsApp takes 17 minutes.
On the spending side, Sensor Tower counts nearly 150 billion app downloads in 2025, almost flat on 2024, and $167 billion of consumer spending in apps, up 10.6%. Downloads have stopped growing while spending has not, which is the clearest sign that the phone has become a mature channel: the same people, spending more.
Mobile's share of the internet
StatCounter measures the devices that visit the websites it tracks. In September 2026, 59.0% of page views worldwide came from mobile phones, 39.3% from desktops and 1.8% from tablets. The split varies by region, with mobile far higher in Africa and Asia and closer to even in North America and Europe.
Each phone also moves more data every year. Ericsson puts average mobile data use at 22 GB per smartphone per month in 2025 and forecasts 42 GB by 2031, driven mostly by video.
What the numbers mean for app developers
- Total time is no longer growing fast. At 3.8% a year, new usage for your app has to come from someone else's app, so retention is now a competitive metric, not just an internal one.
- Attention arrives in short bursts. 186 checks a day at under four hours means the average session is a couple of minutes. Design for the glance, and make the first screen useful without a tap.
- The people who use phones most are the people who also use most apps: 41 a month in the UK. Being installed is not the same as being used.
- One in six US adults reaches the internet only through a phone, and they skew young and lower-income. If your sign-up flow assumes a desktop step, you lose them.
- AI apps tripled their hours in a year. They are taking time from somewhere, and for most categories that somewhere is you.
Device numbers, ownership by country and the Android/iOS split are in the smartphone statistics report.
How these figures are counted
Sensor Tower's hours, downloads and spending are modelled estimates built from its panel of devices and app store data, covering iOS and Google Play but not third-party Android stores in China. Ofcom's Online Nation figures come from Ipsos iris, a metered panel of UK adults, for May 2025, and cover personal use only. Pew's figures are from a probability-based survey of 5,022 US adults conducted February to June 2025. Reviews.org surveyed about 1,000 US adults online through Pollfish in the fourth quarter of 2025, weighted by age, gender and region; self-reported screen time is usually lower than measured screen time. StatCounter's device shares are of web page views on the sites it tracks. Ericsson's data-per-smartphone figure is from its Mobility Report, November 2025 edition.
FAQs
How much time does the average person spend on their phone?
About 3.6 hours a day in apps, by Sensor Tower's measurement of 2025 usage. US adults report about 4 hours a day, from just over 4 hours for Gen Z to just over 2 hours for Baby Boomers. UK adults spend about 3 and a half hours a day on their phones out of 4 and a half hours online.
How many times a day do people check their phones?
US adults say 186 times a day in Reviews.org's late-2025 survey, down from 205 a year earlier. That is about once every five minutes while awake. 84.6% check within ten minutes of waking.
Which age group uses smartphones the most?
Young adults. 63% of Americans aged 18 to 29 are online almost constantly, against 14% of those 65 and over (Pew, 2025). In the UK, 18 to 24 year olds spend 5 hours 5 minutes a day on their phones, compared with 3 hours 20 minutes online in total for the over-65s (Ofcom, 2025).
What percentage of internet traffic comes from mobile?
59% of web page views worldwide came from mobile phones in September 2026, with 39% from desktops and 2% from tablets, according to StatCounter.
How many apps does the average person use?
UK adult smartphone users opened an average of 41 different apps in May 2025, according to Ofcom. Globally, Sensor Tower counted nearly 150 billion downloads in 2025, almost unchanged from 2024, while spending in apps rose 10.6% to $167 billion.
Sources
- Sensor Tower: State of Mobile 2026, January 2026
- Reviews.org: Cell Phone Usage Stats 2026, survey of about 1,000 US adults, Q4 2025
- Pew Research Center: Internet use, smartphone ownership and digital divides in the US, January 2026
- Ofcom: Online Nation 2025, December 2025
- StatCounter: desktop vs mobile vs tablet market share worldwide, September 2026
- Ericsson: Mobility Report key figures, November 2025
- DataReportal: Digital 2026 Global Overview Report
All figures were checked against the sources above on October 6, 2026.