
 Sunil Gill
Mobile phones generated 59.0% of the world's web page views in September 2026, against 39.3% from desktop computers and 1.8% from tablets, according to StatCounter. The split has barely moved for several years, but it hides enormous regional differences: 77% of traffic is mobile in India and under half in the United States, where desktops and phones are level.
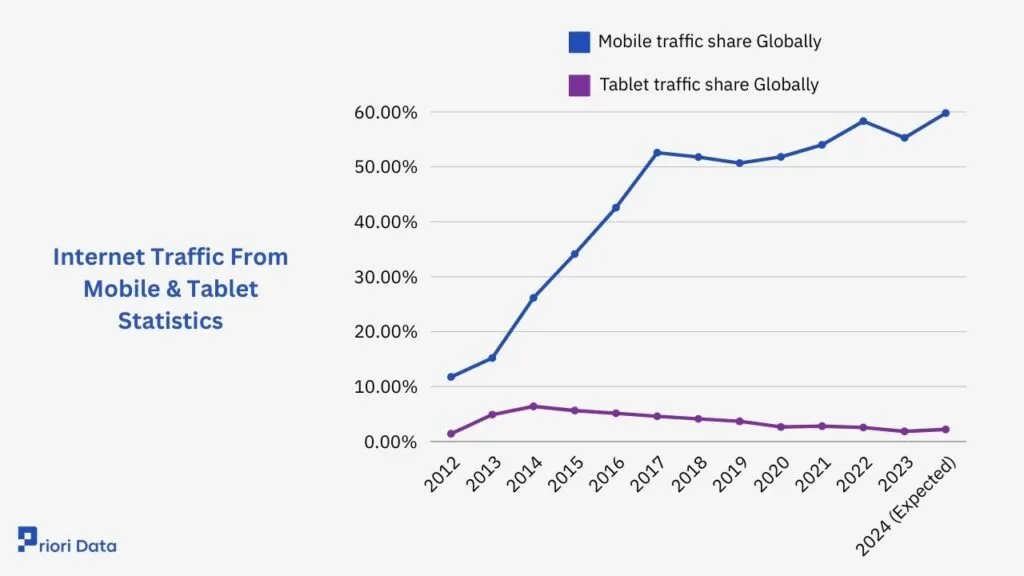
"Mobile internet traffic" means two different things, and this report covers both. One is the share of web visits that come from phones, which StatCounter measures from the sites it tracks. The other is the volume of data moving over mobile networks, which Ericsson measures in exabytes. Each figure carries its date and source.
Mobile internet traffic: the key figures
- 59.0% of worldwide web page views come from mobile phones, 39.3% from desktops and 1.8% from tablets (StatCounter, September 2026).
- In the United States it is 49.1% mobile and 48.5% desktop. In India it is 77.3% mobile.
- Mobile networks carried 146 exabytes of data a month at the end of 2025, or 203 EB including fixed wireless access, and 2025 saw the largest yearly increase ever (Ericsson).
- 5G carried 48% of mobile data traffic at the end of 2025, up from 34% a year earlier, and is forecast to carry 85% by 2031.
- The average smartphone used 22 GB of mobile data a month in 2025; in India it was 37 GB (Ericsson).
- About 6 billion people, 74% of the world, use the internet, and 2.2 billion remain offline (ITU, 2025).
Mobile's share of web traffic by region
StatCounter's figures count page views on the websites that run its tracking code, so they describe browsing rather than app use. By that measure, the mobile share of the internet depends mostly on how many people have a computer.
View as table
| Period | Value |
|---|---|
| Africa | 68.7% |
| Asia | 67.0% |
| World | 59.0% |
| Europe | 55.4% |
| S. America | 52.0% |
| N. America | 49.4% |
| Oceania | 47.9% |
Source: StatCounter Global Stats, September 2026
| Region, September 2026 | Mobile | Desktop | Tablet |
|---|---|---|---|
| Worldwide | 59.0% | 39.3% | 1.8% |
| Africa | 68.7% | 30.4% | 0.9% |
| Asia | 67.0% | 31.7% | 1.3% |
| Europe | 55.4% | 42.3% | 2.3% |
| South America | 52.0% | 47.5% | 0.6% |
| North America | 49.4% | 48.3% | 2.4% |
| Oceania | 47.9% | 49.1% | 2.9% |
| United States | 49.1% | 48.5% | 2.4% |
| India | 77.3% | 22.1% | 0.6% |
Two things are worth noticing. The world average is pulled up by Asia and Africa, where for most people the phone is the only computer. And in the richest markets the web is still half a desktop medium, because people browse at work. Oceania is the one region where desktops lead. Tablets have faded to a rounding error everywhere.
StatCounter does not see apps, and the smartphone usage statistics report shows that is where most phone time goes: about 3.6 hours a day in apps, against far less in a mobile browser. The web share understates the phone's share of attention.
Mobile data traffic in exabytes
Ericsson measures what mobile networks carry. At the end of 2025, mobile data traffic (excluding fixed wireless) ran at 146 exabytes a month, and total mobile network traffic including fixed wireless access at 203 EB a month. An exabyte is a billion gigabytes.
View as table
| Period | Value |
|---|---|
| India | 37 GB |
| Gulf | 30 GB |
| W. Europe | 25 GB |
| N. America | 25 GB |
| Global | 22 GB |
| Latin America | 15 GB |
| Sub-Saharan Africa | 5 GB |
Source: Ericsson Mobility Report, June 2026
| Region | GB per smartphone per month, 2025 | Forecast 2031 |
|---|---|---|
| India, Nepal, Bhutan | 37 | 70 |
| Gulf Cooperation Council | 30 | 49 |
| Western Europe | 25 | 59 |
| North America | 25 | 52 |
| Central and Eastern Europe | 23 | 50 |
| North East Asia | 23 | 45 |
| Global average | 22 | 42 |
| Middle East and North Africa | 21 | 47 |
| South East Asia and Oceania | 21 | 40 |
| Latin America | 15 | 32 |
| Sub-Saharan Africa | 5 | 12 |
India uses the most data per phone in the world, 37 GB a month, in a market where mobile data is cheap and the phone is the main screen for video. Sub-Saharan Africa uses the least at 5 GB. Ericsson expects the global average to nearly double to 42 GB by 2031 and total mobile data traffic to reach 328 EB a month, a growth factor of about 2.2.
5G's share of traffic
5G carried 48% of mobile data traffic at the end of 2025, up from 34% at the end of 2024, on 2.94 billion 5G subscriptions, about a third of all mobile subscriptions. The traffic share runs ahead of the subscription share because 5G users consume more. Ericsson forecasts 5G at 85% of traffic by 2031, with 4G declining as networks are reused for 5G. Subscription figures by technology are in the smartphone statistics report.
Who is online, and who is not
The ITU estimates that about 6 billion people, 74% of the world's population, used the internet in 2025, an increase of more than 240 million in a year. 2.2 billion people remain offline, 96% of them in low- and middle-income countries. Internet use is 94% in high-income countries and 23% in low-income ones. Almost all of the people who come online from here will do so on a phone, which is why the mobile share of traffic will keep rising in exactly the regions where it is already highest.
What the numbers mean for app and web developers
- Design for the phone first everywhere except North America and Oceania, and even there assume half your visitors are on one.
- The US is the market where a desktop version still earns its keep. Half of American web traffic is desktop.
- Data cost is a product constraint in Africa and Latin America, where phones use 5 to 15 GB a month. Video-first onboarding that works in Mumbai on 37 GB plans will not work in Lagos.
- 5G at 48% of traffic means heavier content is viable for about half of mobile sessions, but the other half is on 4G or worse. Adaptive quality still matters.
- Growth in traffic is now mostly existing users doing more, not new users arriving. Ericsson's forecast is a doubling of data per phone, not of phones.
How these figures are counted
StatCounter's device shares are calculated from page views across the websites that use its analytics, for the month stated; they do not include traffic inside apps and over-represent sites that install StatCounter. Ericsson's traffic figures are from the June 2026 Ericsson Mobility Report, based on measurements across live networks and its own modelling, with per-smartphone averages taken as traffic divided by active smartphones. The ITU's internet-use figures are its annual estimates compiled from national statistics for Facts and Figures 2025.
FAQs
How much of internet traffic is mobile?
59.0% of web page views worldwide came from mobile phones in September 2026, with 39.3% from desktops and 1.8% from tablets, according to StatCounter. The share ranges from 77% in India to 49% in the United States.
Is mobile traffic higher than desktop in the US?
Only just. In September 2026 StatCounter put US web traffic at 49.1% mobile, 48.5% desktop and 2.4% tablet. North America and Oceania are the only regions where desktop is level with or ahead of mobile.
How much mobile data does the average person use?
22 GB per smartphone per month globally at the end of 2025, according to Ericsson, ranging from 37 GB in India to 5 GB in Sub-Saharan Africa. The global average is forecast to reach 42 GB a month by 2031.
How much data do mobile networks carry?
146 exabytes a month of mobile data at the end of 2025, or 203 exabytes including fixed wireless access, per Ericsson. 5G carried 48% of it. Mobile data traffic is forecast to reach 328 exabytes a month in 2031.
How many people use the internet?
About 6 billion, or 74% of the world's population, in 2025, according to the ITU. 2.2 billion people are still offline, almost all of them in low- and middle-income countries.
Sources
- StatCounter: desktop vs mobile vs tablet market share, worldwide and by region, September 2026
- Ericsson: mobile data traffic outlook and key figures, Ericsson Mobility Report, June 2026 and November 2025 editions
- ITU: Facts and Figures 2025, November 17, 2025
All figures were checked against the sources above on October 6, 2026.